
Understanding the Map Tools
Essential map buttons (top of map)
Use these daily to get a quick overview of the property and surrounding neighbourhood.
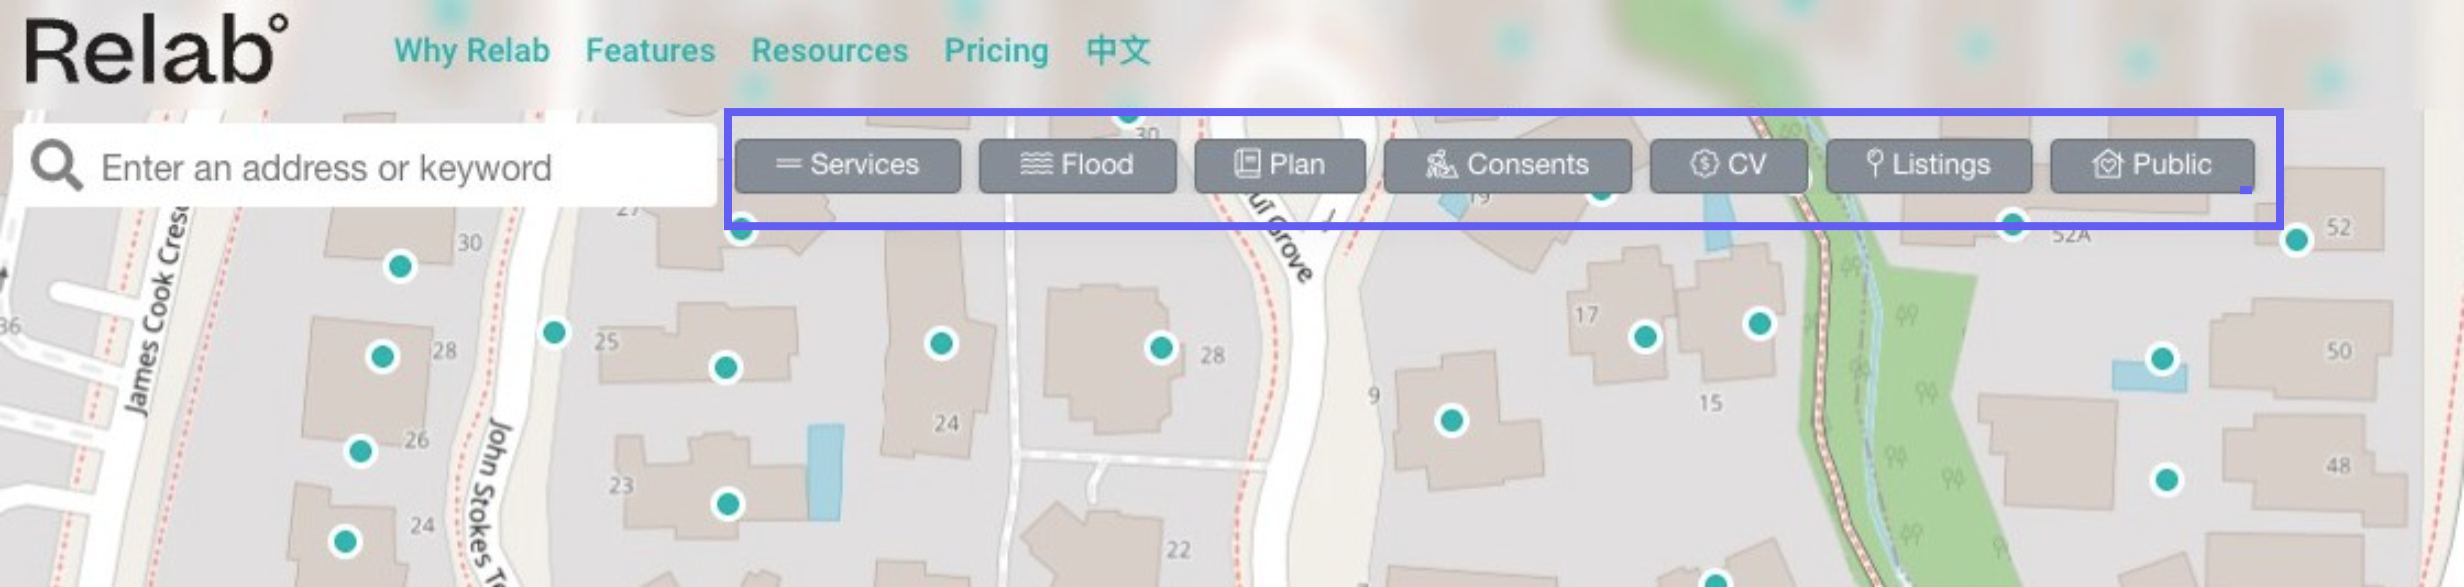
Depending on your region, you may see the following overlays:
- Services Overlay - shows underground infrastructure
- Flood Overlay - shows flooding risks
- Plan Overlay - shows zoning (residential, commercial etc)
- Consents Overlay - shows building and resource consents
- Public Overlay - shows government owned land
- CV Overlay - shows council valuation
- Listings Overlay - shows market activity
Disabled overlay toggles: Some map overlays require a minimum zoom level before they can display data. When you're zoomed out too far, these overlay toggle buttons appear greyed out at the top of the map instead of disappearing entirely. Hover over a greyed-out toggle to see a "Zoom in to view" tooltip. Zoom in closer and the toggle becomes active again.
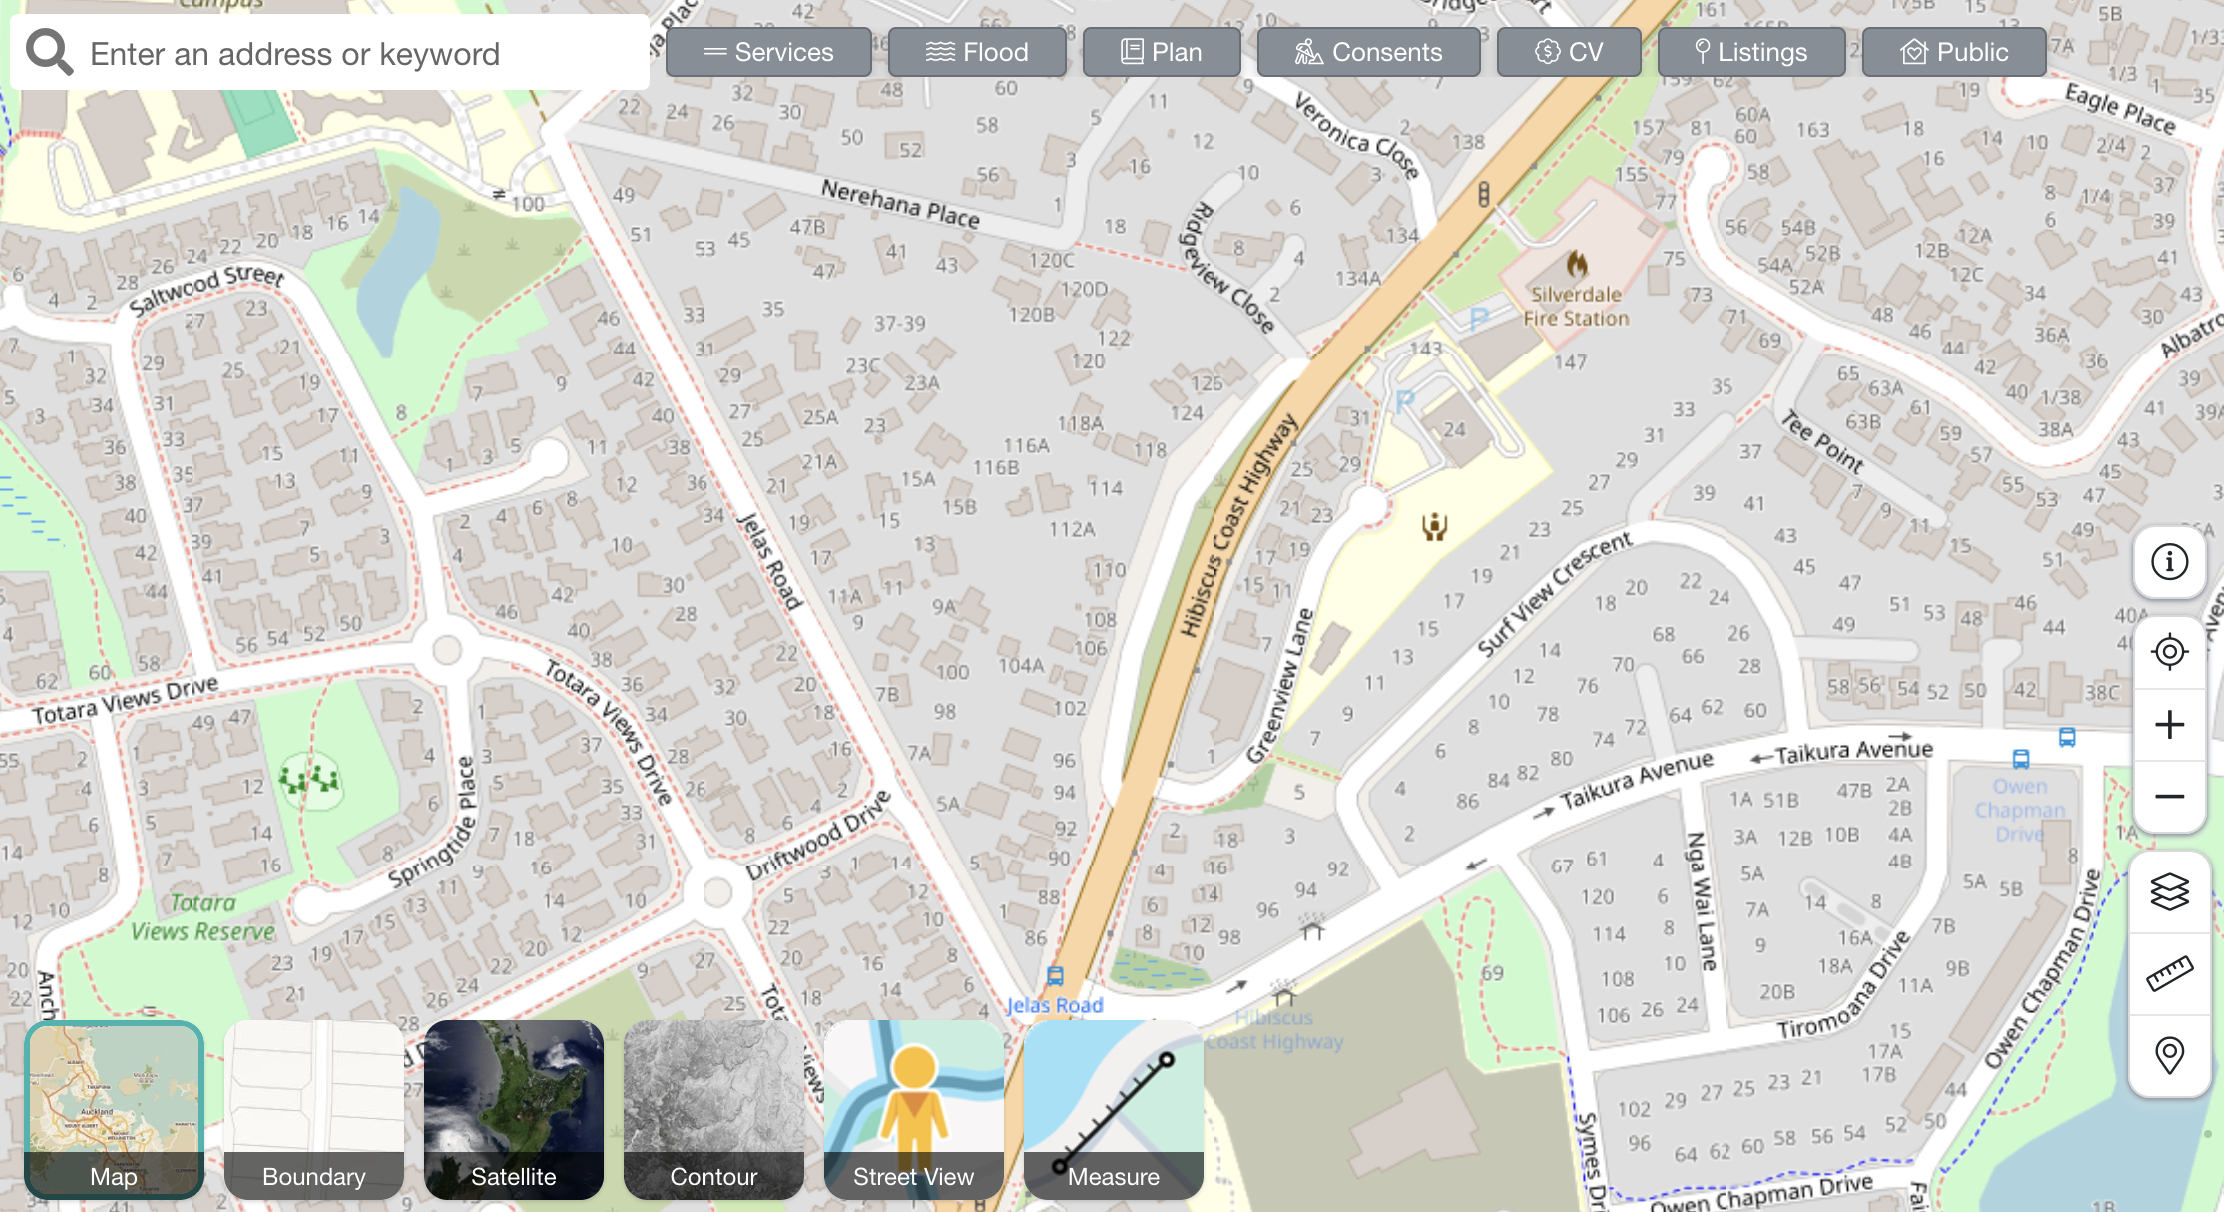
Base map layers
Default map
This map serves as the starting point for all map interactions.
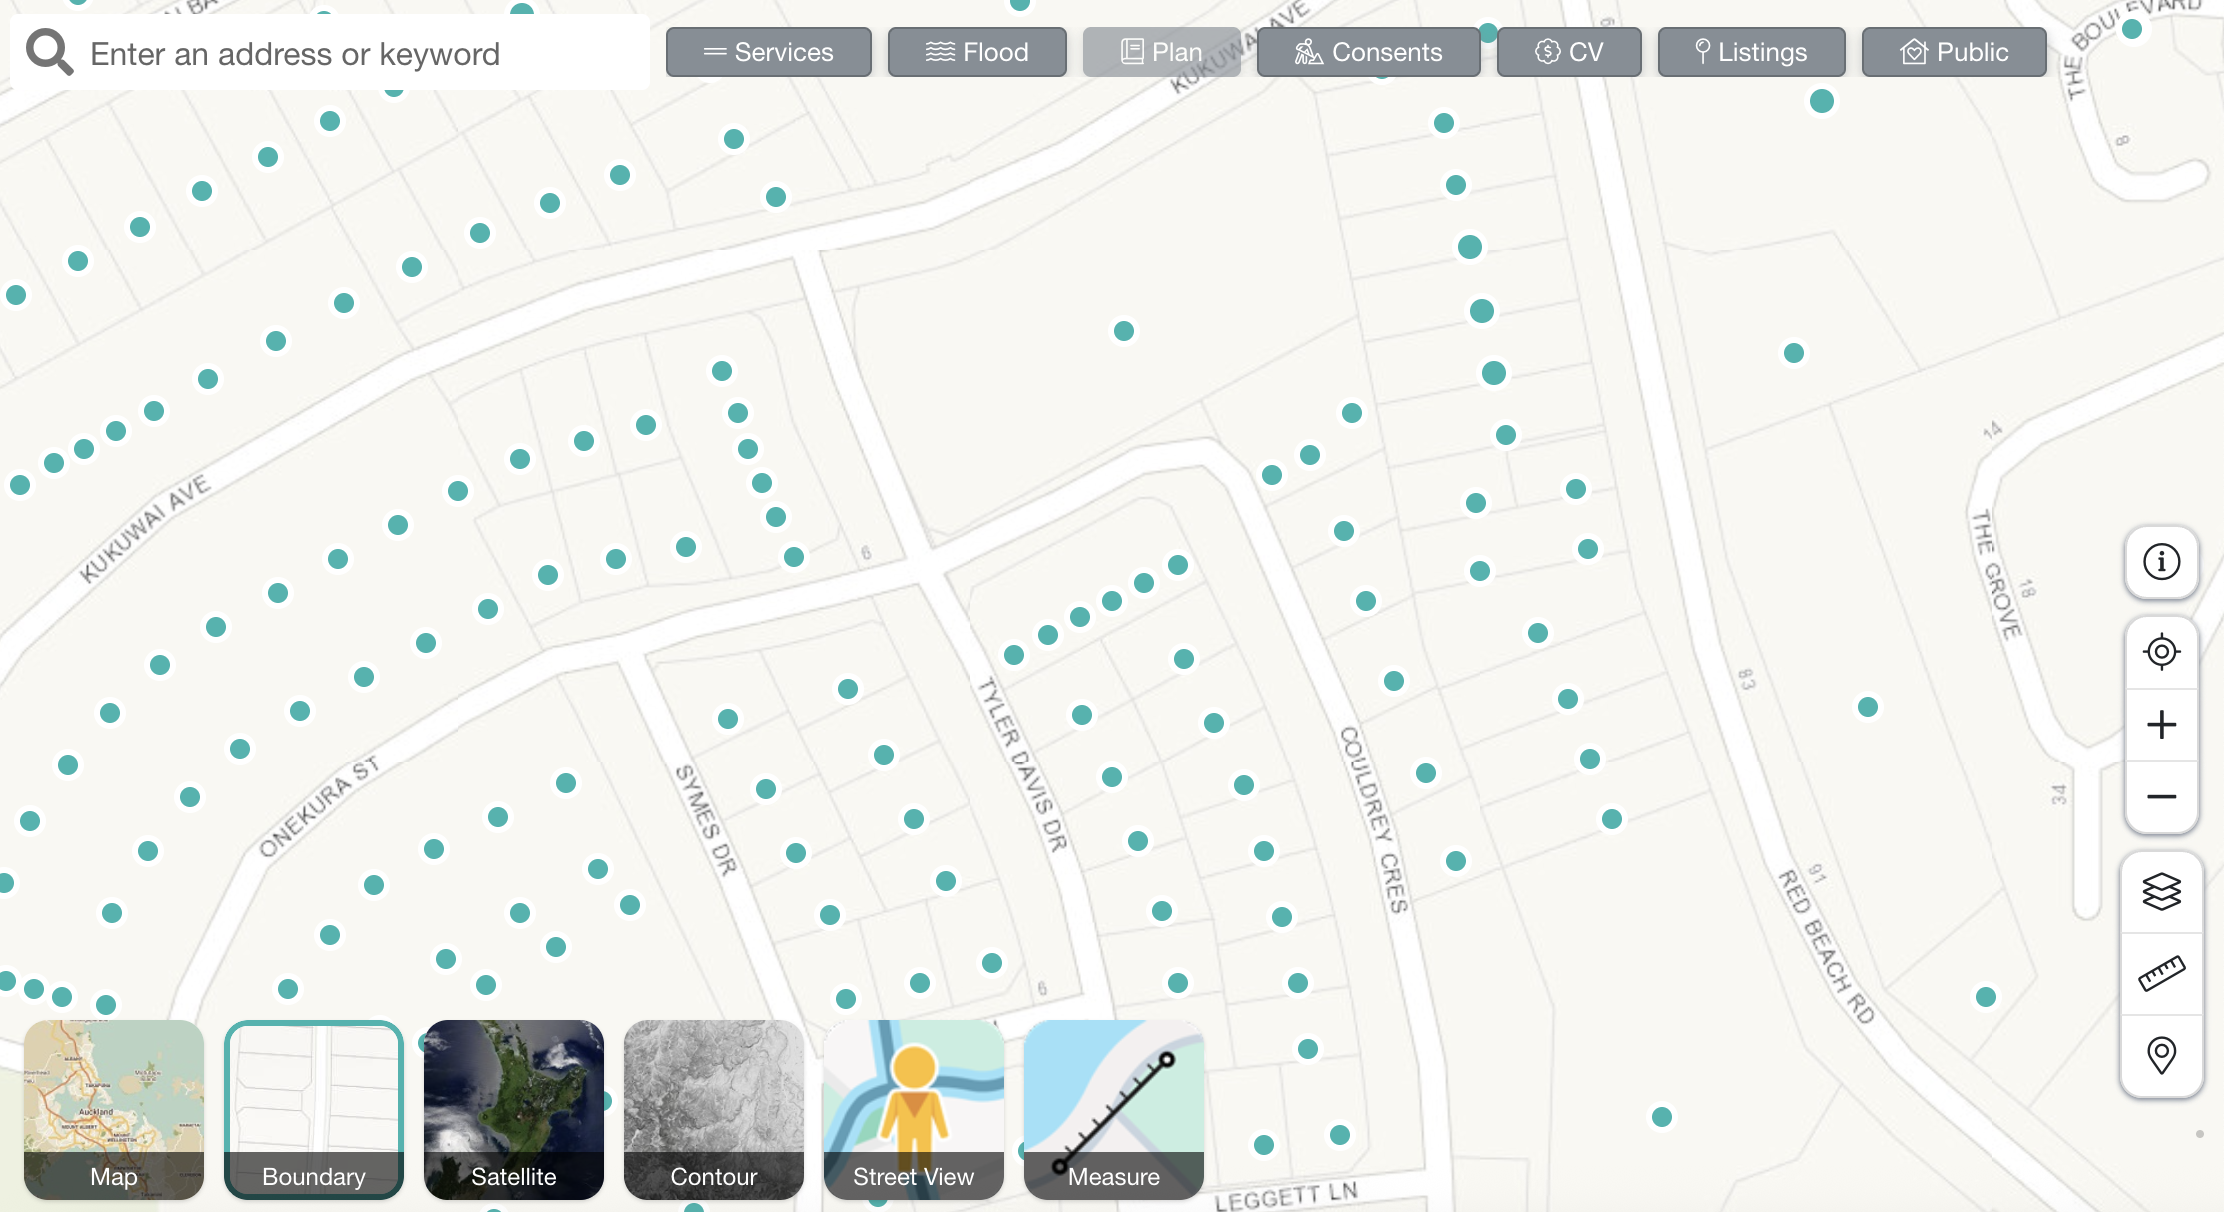
Boundary map
Click on Boundary to view the boundary lines around each property. The titles are represented by dots.
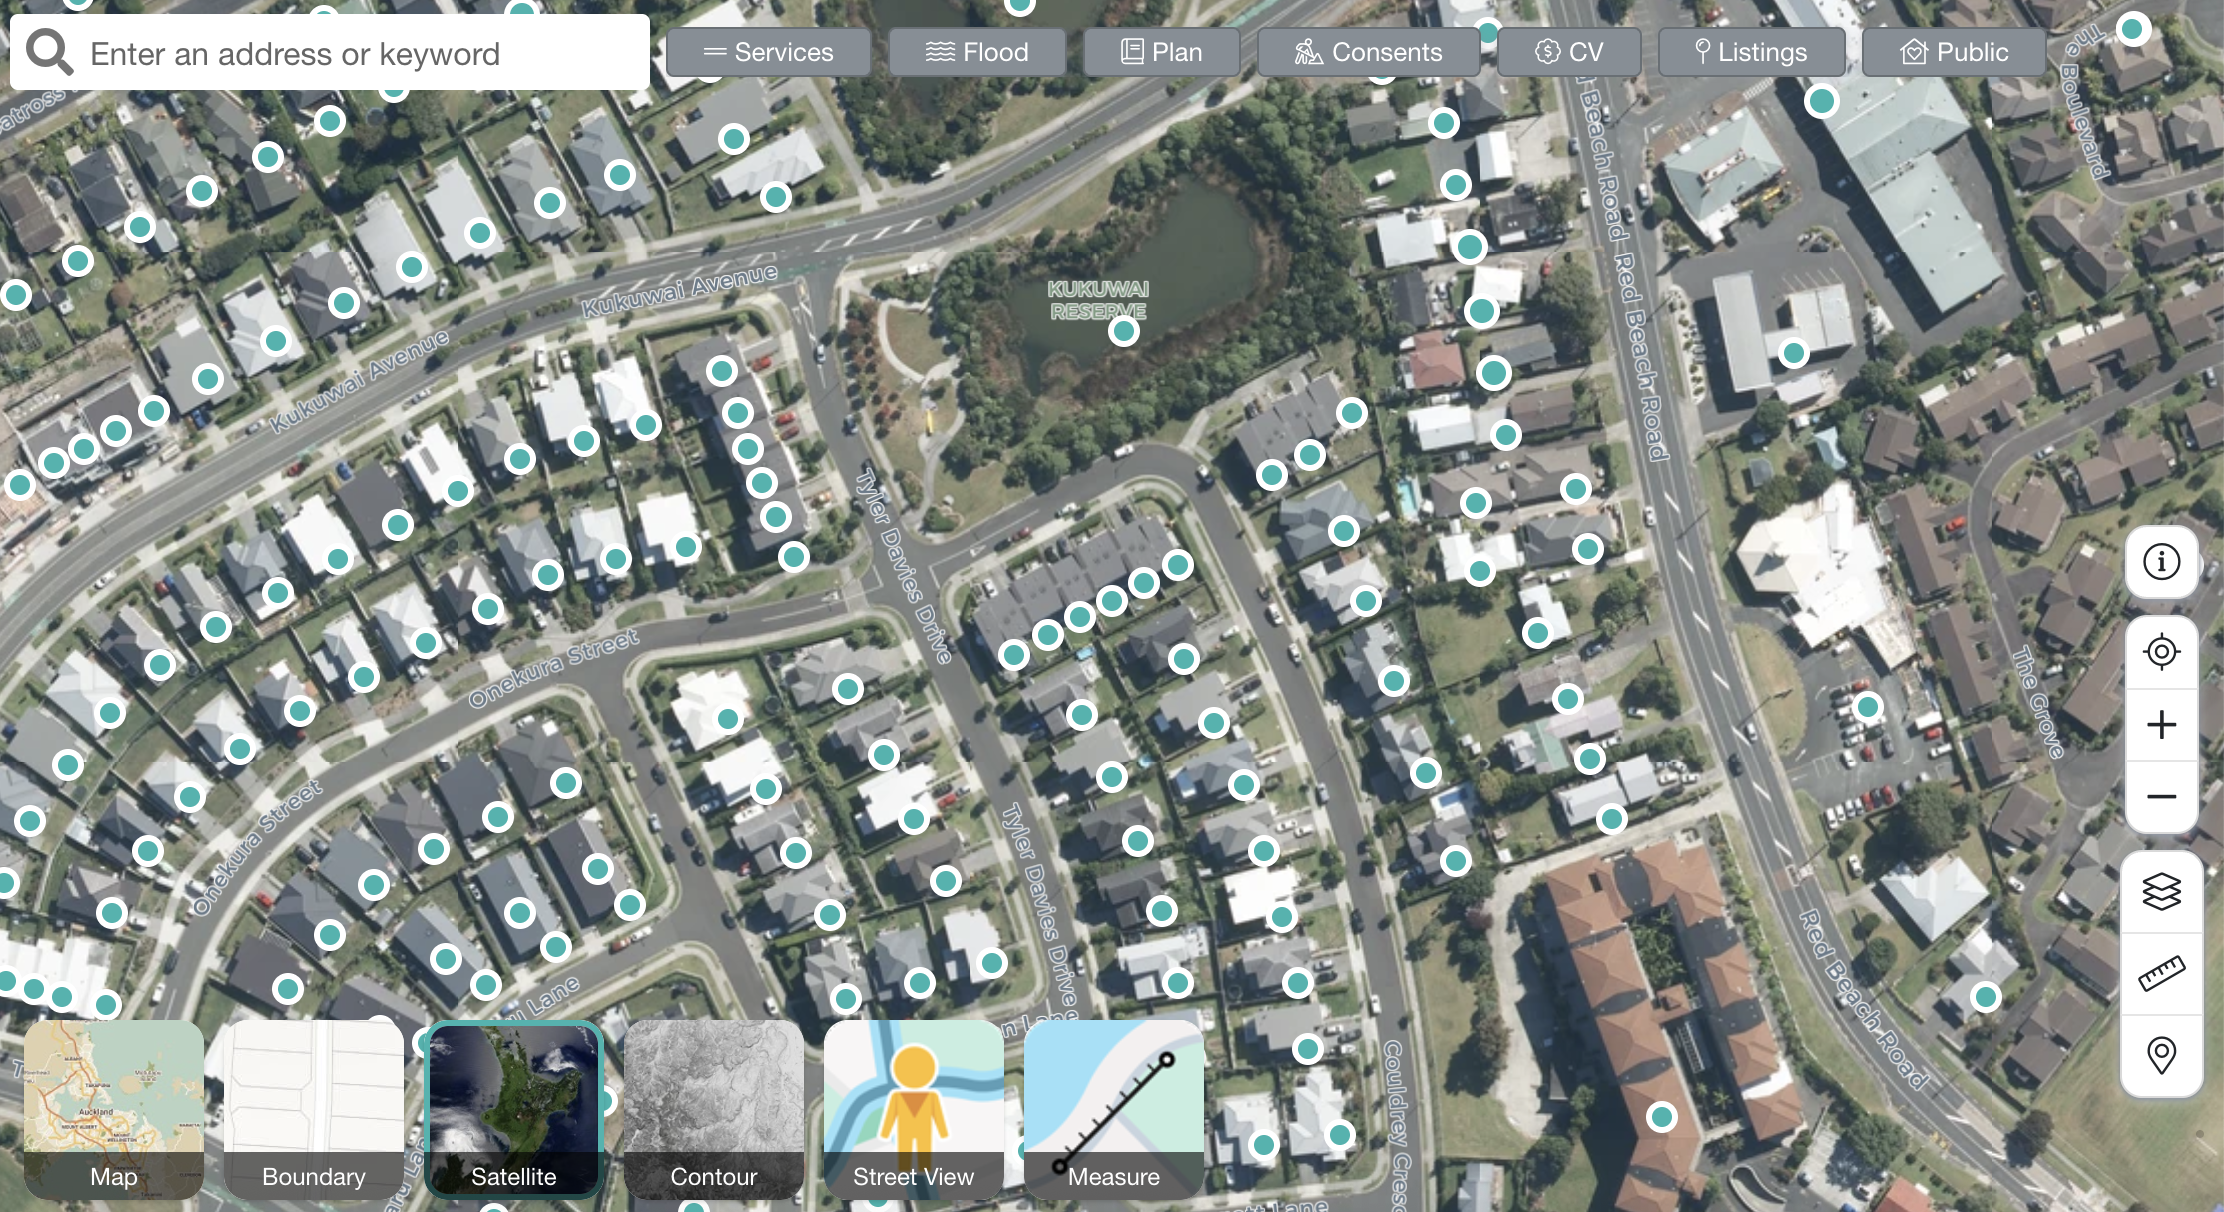
Satellite map
Switch to the satellite map for a Google Satellite view of the properties. We offer industry-leading typography detail down to 0.5m for the utmost clarity.
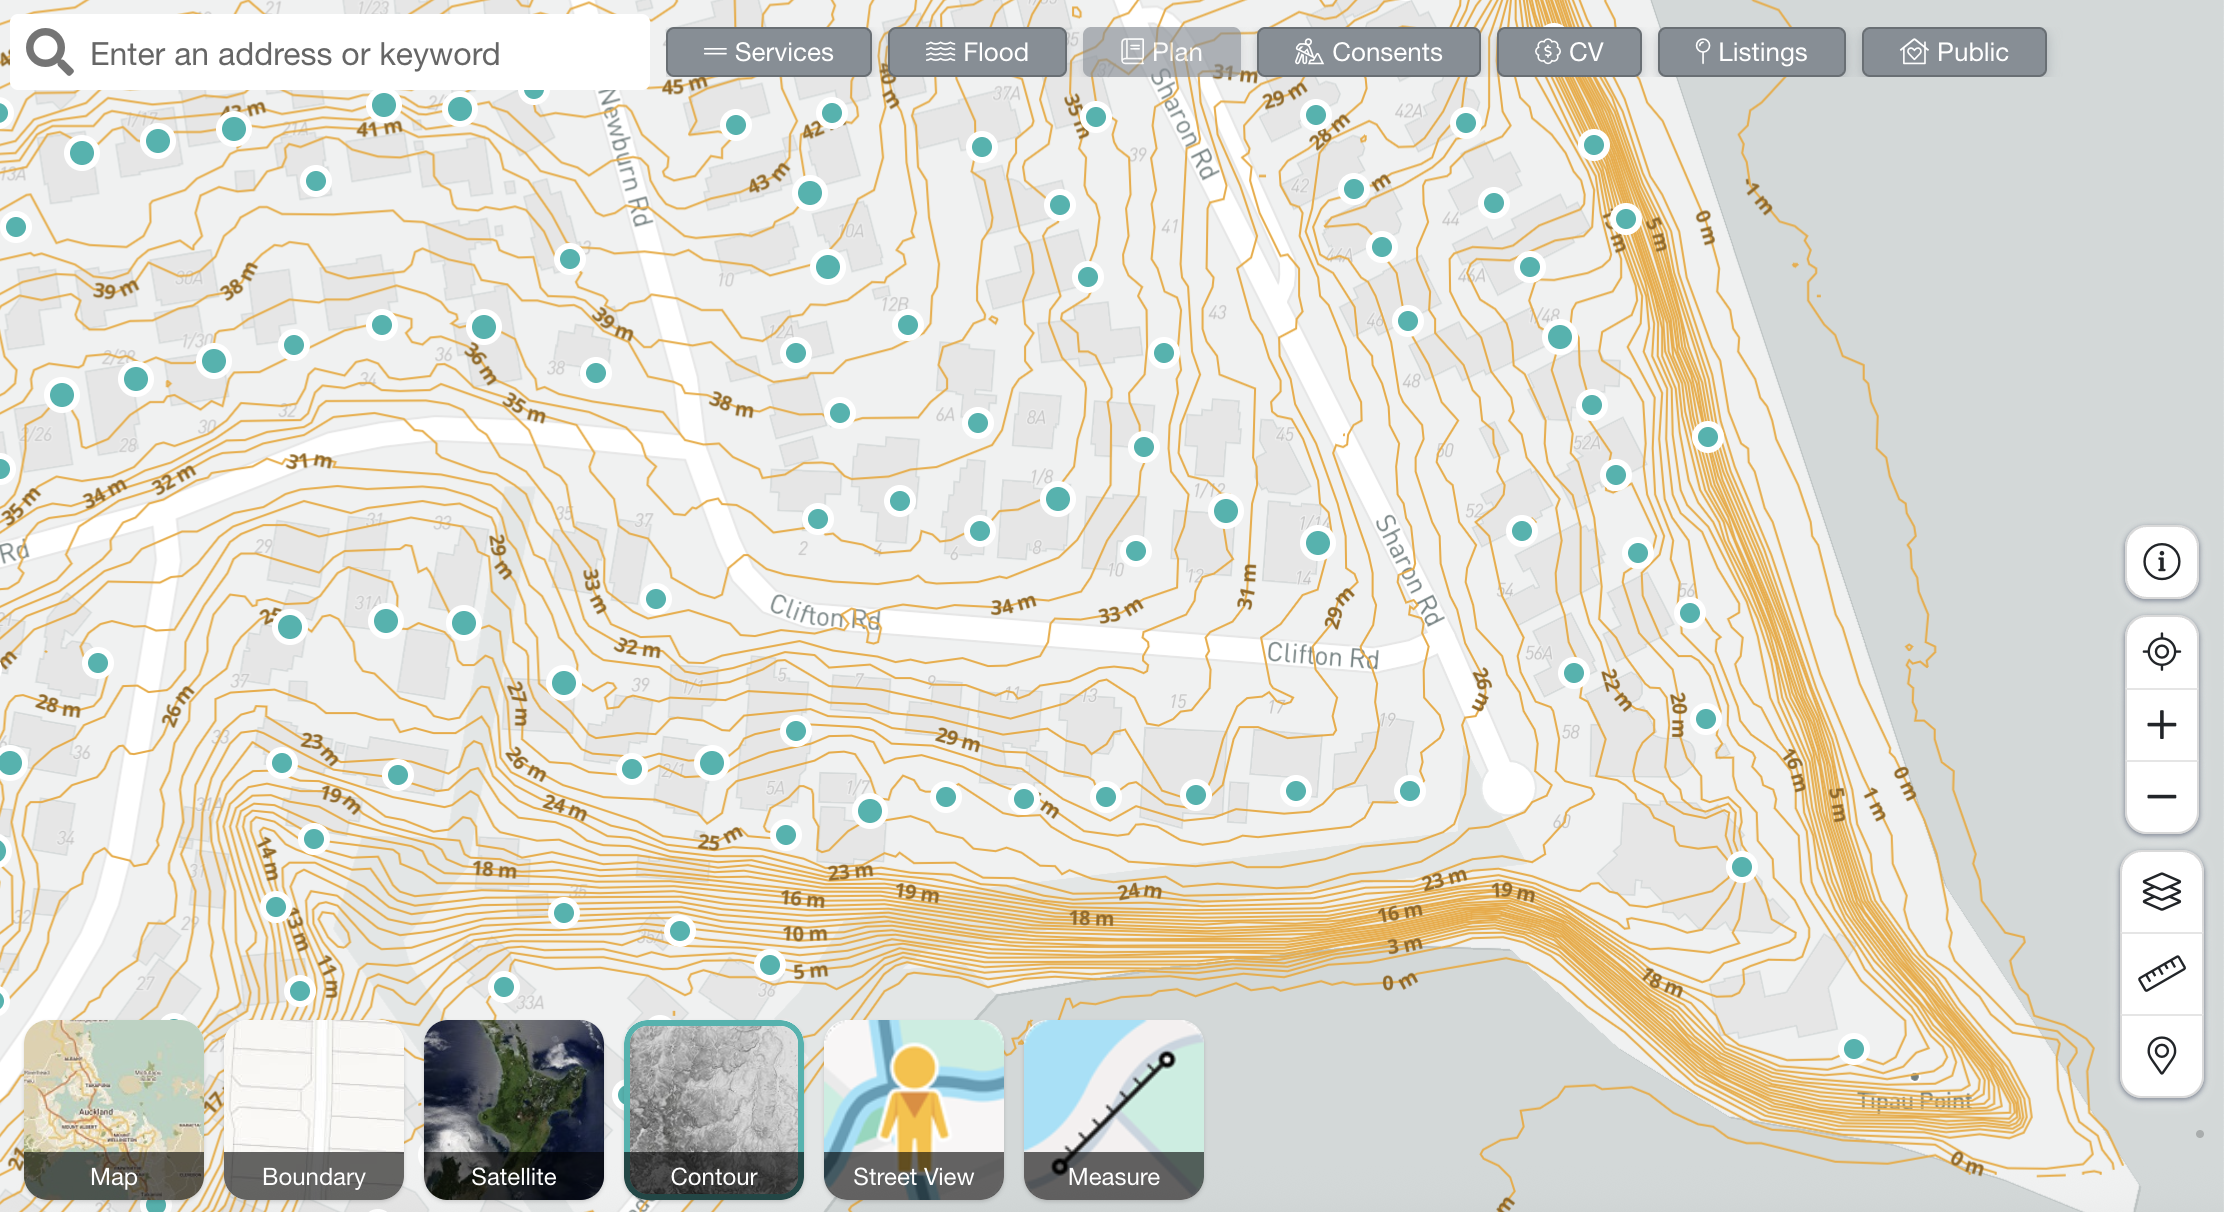
Contour map
Access the contour map to view various contours overlaying the property. Note that contours are measured in metres.
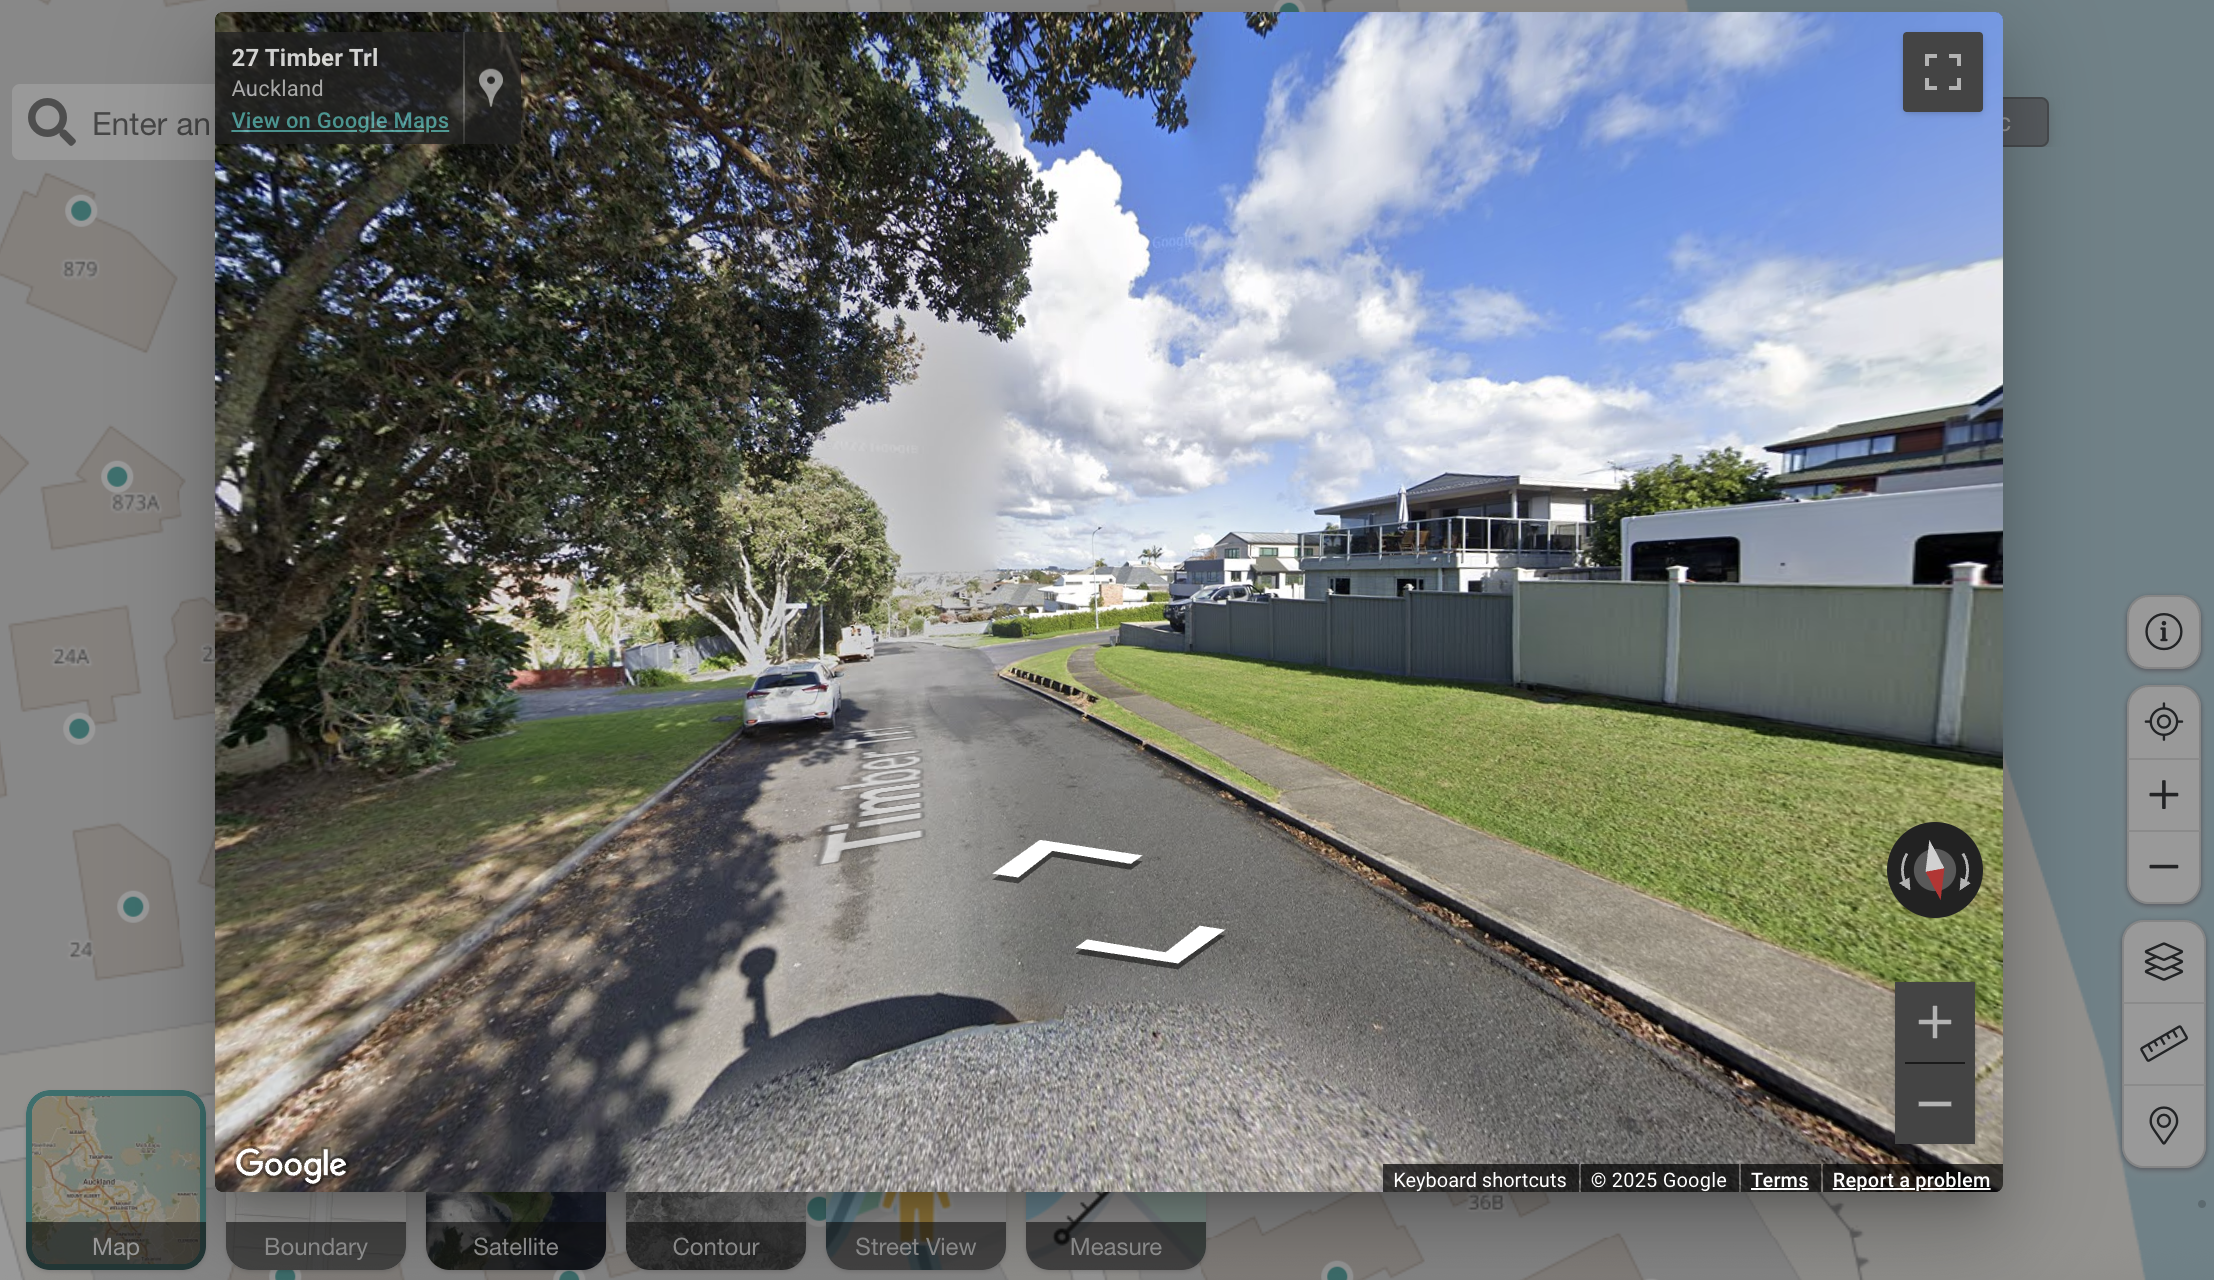
Google Street View
Click on the Street View link located at the bottom of the map. Works just like Google Street View to quickly explore the area.
Measuring tool
Great for measuring up roofs or driveways quickly and easily. For more details, see the Measuring Tool guide.
Additional tools
- Export Map - Save any map view as an image
- Map Pin - Select properties by clicking anywhere on the map
- Multi-Select Tool - Analyse up to 100 properties at once
- Polygon Tool - Draw custom shapes for CMA comparables
FAQs
Why is the Plan Overlay button greyed out?
If you see the Plan Overlay option greyed out, this means we have plan data for your region but it cannot be displayed on the Boundary Map view. To access plan overlays, switch to Default map view, Satellite view, or Contour map view.
Which regions have plan overlays available?
Plan overlay data is currently available in key New Zealand regions including Auckland, Waikato, and Christchurch. Coverage is continuously expanding as councils make their data available.
How do I print or save a property map?
The fastest method is to take a screenshot of the map and save it as an image file. Alternatively, you can use the Export Map feature or download our Property Summary Report, which includes an A4-sized map with flooding and services information.
Why can’t I see the map layers?
Map layers can be turned on and off using a button on your map (pictured below). They also could be hidden if your browser window is zoomed in, or the map is still loading. Try adjusting your zoom level, resizing the window, or refreshing the page. If the issue continues, try accessing Relab on another browser, we suggest Chrome.
Why can’t I see the map toggles?
If toggles aren’t visible, they could be hidden if you r browser window is zoomed in, or the map is still loading. Try adjusting your zoom level, resizing the window, or refreshing the page. If the issue continues, try accessing Relab on another browser, we suggest Chrome.
🔥Hot Tips:
- Use the legend to quickly and accurately interpret the map data
- Many items can be explored in further detail by clicking on them
- Ensure you are zoomed in sufficiently to view details on specific map layers, like the boundary and contour maps